From installing energyPRO, a part of the installation contains a library of different examples and country specific datasets such as weather data and electricity prices. The default directory for this library is C:\energyPRO Data\.
From energyPRO these data and examples can be loaded and used for inspiration when setting up your own project.
Please have a look at this video where we visit a district heating plant in Denmark using energyPRO on a daily basis.
If you cannot find an example that is relevant for the system you wish to model, feel free to contact us at energyPRO@emd.dk
Danish cogeneration plant and solar collectors in separate sites
This project example is a model of the Danish district heating plant in the city of Ringkøbing. For further information about Ringkøbing District Heating, see our online presentation where you can monitor the daily operation.
The energyPRO model of Ringkøbing district heating plant includes a natural gas fired CHP, an electric boiler, solar collectors, gas fired boilers and a thermal storage. These units must at all times cover the city’s heat demand. Produced and consumed electricity is traded on the Day-Ahead spot market in West Denmark.
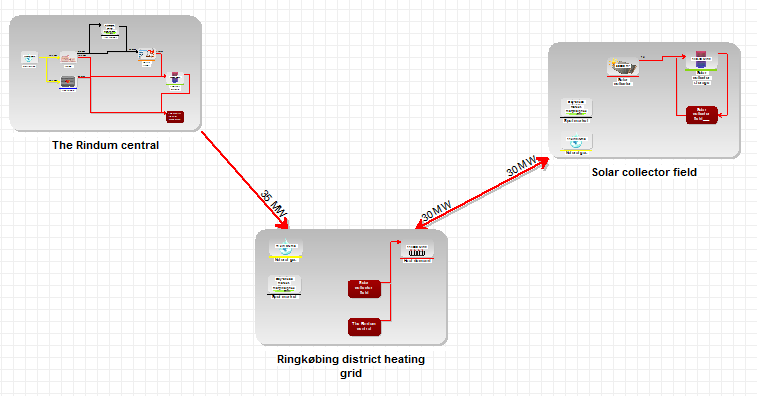
As can be seen in the figure, the district heating grid is divided into three different sites: “The Rindum central”, “Ringkøbing district heating grid” and “Solar collector field”. The arrows between each site indicates heat flow directions and limitations.
energyPRO calculates the optimal operation of the units in the project, which in this case is by covering the heat demand at the lowest possible price. Since the solar collectors have a low marginal production cost, their production is prioritized before the other units in the system. The solar collectors should therefore produce as much heat as possible supported by the flexibility the heat storage provides. The CHP should be operated in hours with high electricity prices and the electric boiler in hours with low electricity prices.
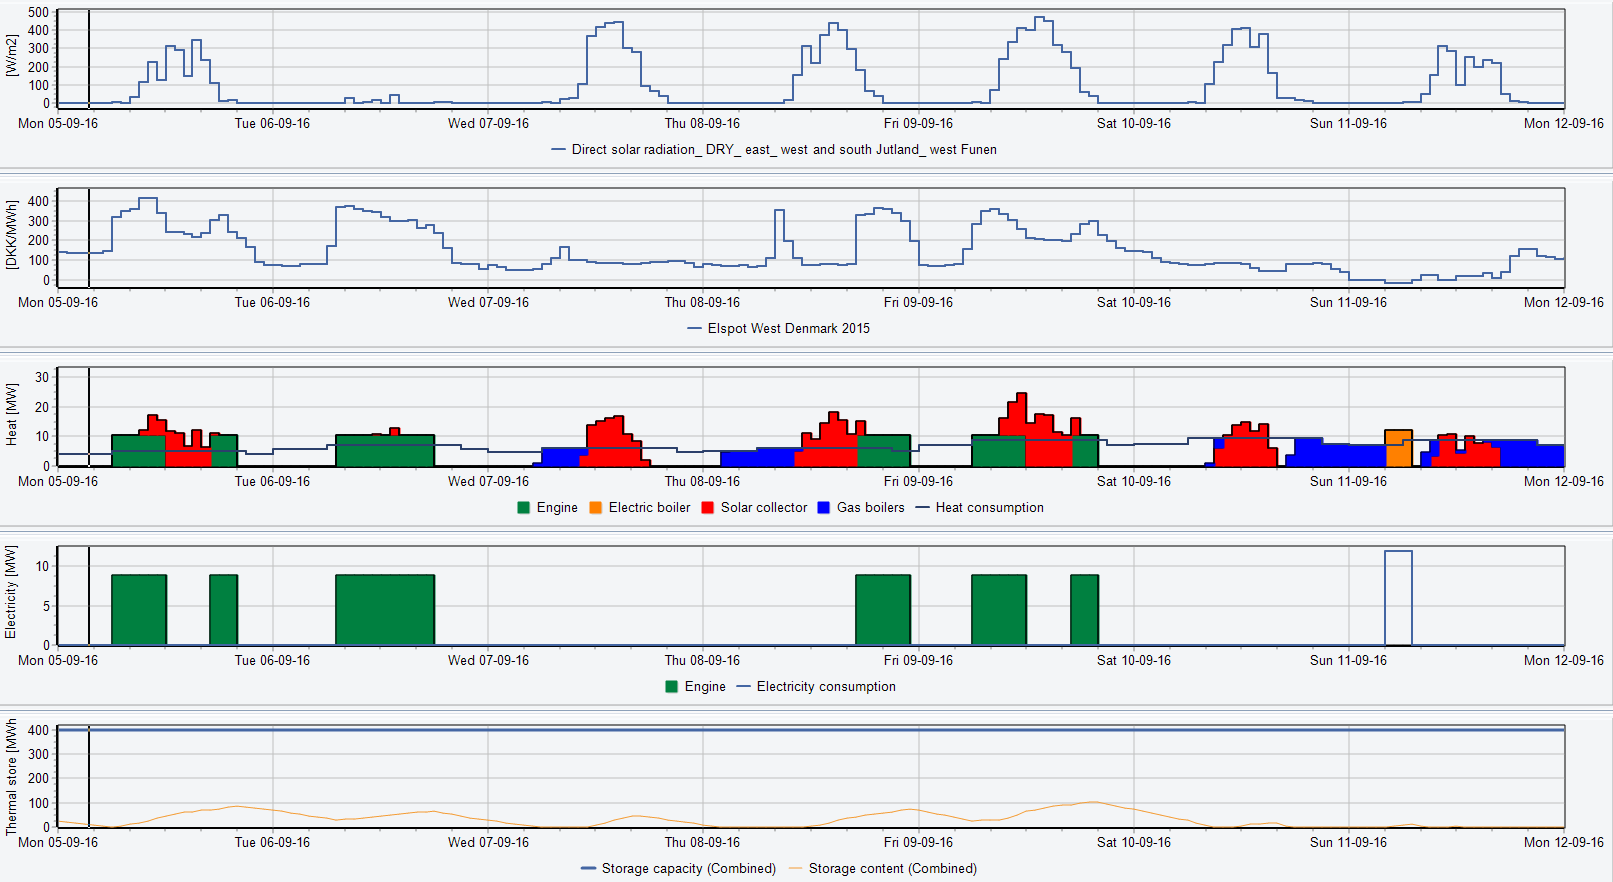
In the figure, a graphical representation of the operation can be seen. The figure is composed of five graphs: The top graph shows the solar radiation in every hour for the given location. This is used to calculate the heat production from the solar collectors. The second graph shows the electricity price in West Denmark every hour. The third graph shows the heat production of the different units and the total heat demand. The fourth graph shows the electricity production and consumption, and the last graph shows the storage capacity and content.
From the figure it can be seen that the CHP (green color) is operated in hours with high electricity prices and the electric boiler (orange color) in hours with low electricity prices. The solar collectors (red color) produce as much as possible and the boilers (blue color) covers the rest of the heat demand.
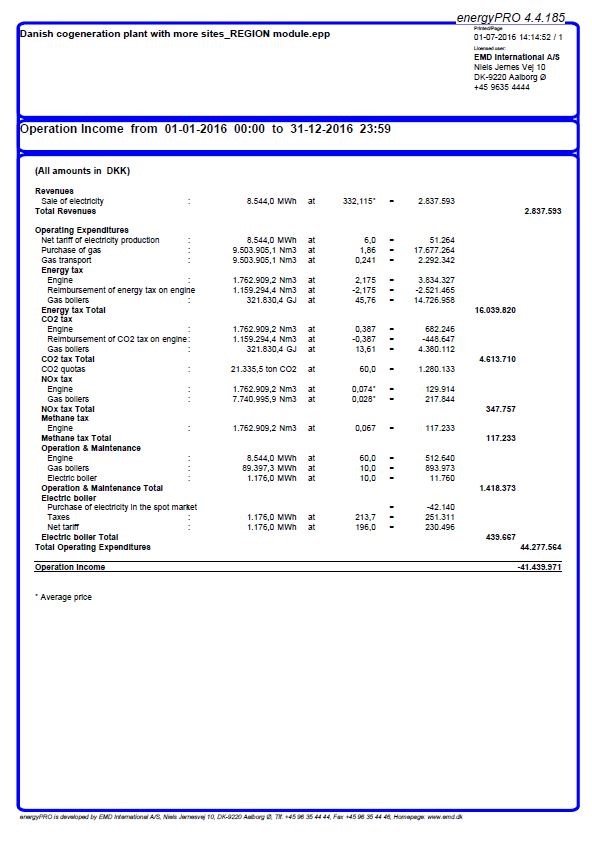
Besides the graphical overview of the operation, it is also possible to generate a number of technical and economic reports. For instance, the report “Operation Income” collects all operational payments, i.e. revenues and expenditures from one year’s operation, as shown in the last figure.
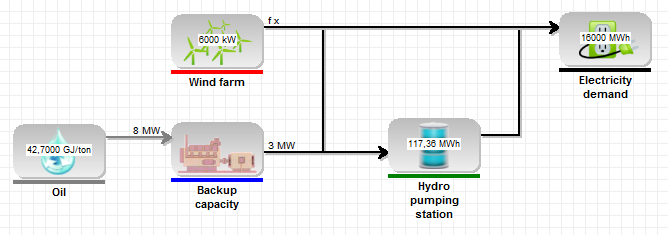
Power plant and wind farm with electricity storage in island operation
This example includes a 6 MW wind farm, a pumped hydro storage and an oil fired backup generator. There is no connection to an electricity market, which means that export or import of electricity is not possible. Therefore, the model is said to be running in “island operation”.
energyPRO calculates the optimal operation of the units in the project. In this case, the wind farm should cover as much of the electricity demand as possible by utilizing the hydro storage in the best possible way.
In the next figure, a graphical representation of the operation can be seen. The figure is composed of four graphs: The top graph shows the wind speed in every hour for the given location. This is used to calculate the electricity production from the wind farm. The second graph shows the electricity production from the wind farm (red color) and the backup generator (blue color) and the total electricity demand (orange curve). The third graph, shows the charging (orange color) and discharging (blue curve) of the battery. The last graph shows the electric storage’s capacity and its content.
As can be seen in the figure, the excess wind power production is used to charge the storage by pumping water up in the reservoir. This energy is saved until the wind power production cannot cover the electricity demand and the storage is discharged. The backup unit is used to cover the rest of the demand when the store is empty.
Cogeneration plant and electric heat pump on fixed tariffs
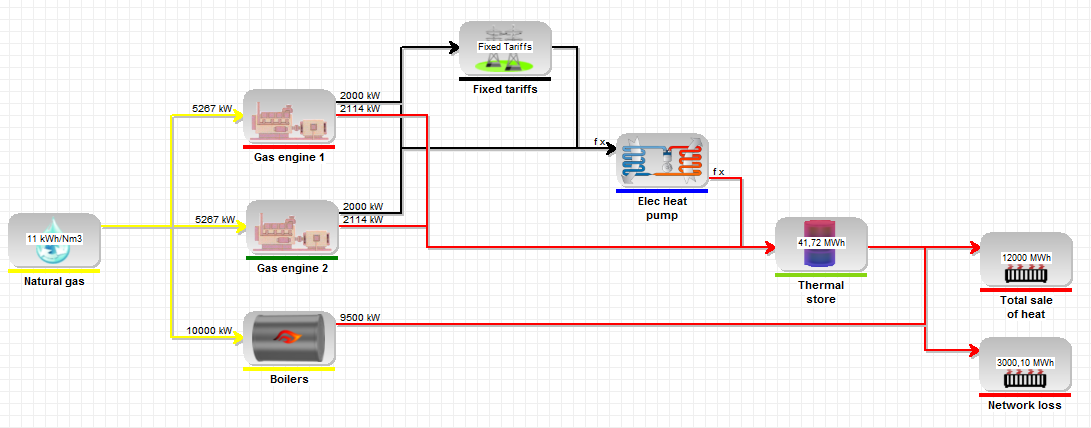
This project includes two gas fired CHPs, an electric heat pump, gas fired boilers and a thermal storage. These different production units must at all times cover the total heat demand which is divided into “Total sale of heat” and “Network loss”. Produced and consumed electricity is traded on a fixed tariffs market with a high day-time tariff and a low night-time tariff. The weekend is also a low tariff period.
The optimal operation is calculated in energyPRO, which in this case is achieved by minimizing the net heat production cost. In order to do so, the two CHPs must be operated in hours with high electricity prices (Day tariff) and the heat pump in hours with low electricity prices (Night tariff and weekends). The storage tank will be used to support this strategy by storing excess heat from the CHPs and the heat pump to be used at a later time.
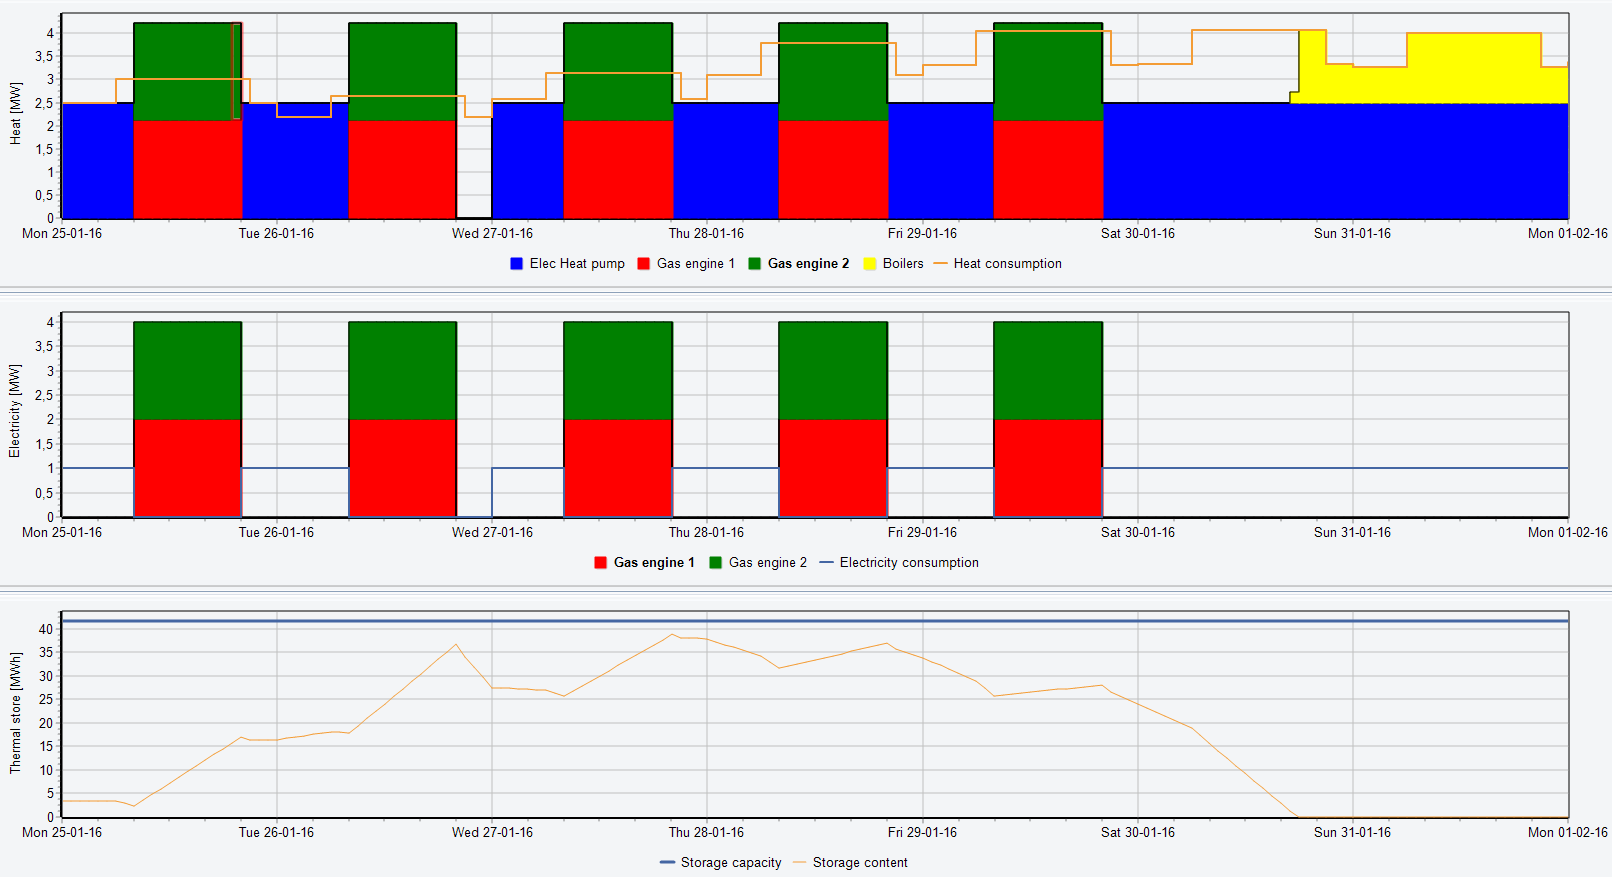
In the figure, a graphical representation of the operation can be seen. The figure is composed of three graphs: The top graph shows the heat production of the different units and the total heat demand. The middle graph, shows the electricity production and consumption, and the last graph shows the storage capacity and content.
From the figure it can be seen that the two CHPs (red and green colors) are producing in the day-time in the weekdays, while the heat pump (blue color) is operated during night-time and in weekends. The gas boilers are operated when the heat pump cannot cover the heat demand and storage tank is empty.
Tri-generation plant on a Day-Ahead market
This project includes two gas fired CHPs, an electric chiller, an absorption chiller, gas fired boilers and a thermal storage. These production units must at all times cover both the cooling demand and the total heat demand which is divided into “Total sale of heat” and “Network loss”. Produced and consumed electricity is traded on a the EPEX Day-ahead market.
energyPRO calculates the optimal operation of the units in the project, which in this model is achieved by minimizing the net heat and cooling production cost. The two CHPs should therefore be operated in hours with high electricity prices and the electric chiller in hours with low electricity prices. The absorption chiller must be supplied with heat in order to run, but this heat must be produced at the lowest possible price. For this reason, the absorption chiller should produce cooling when cheap excess heat is available from the CHPs in hours of high electricity prices. The storage tank will be used to support this strategy by storing excess heat from the CHPs to be used at a later time.
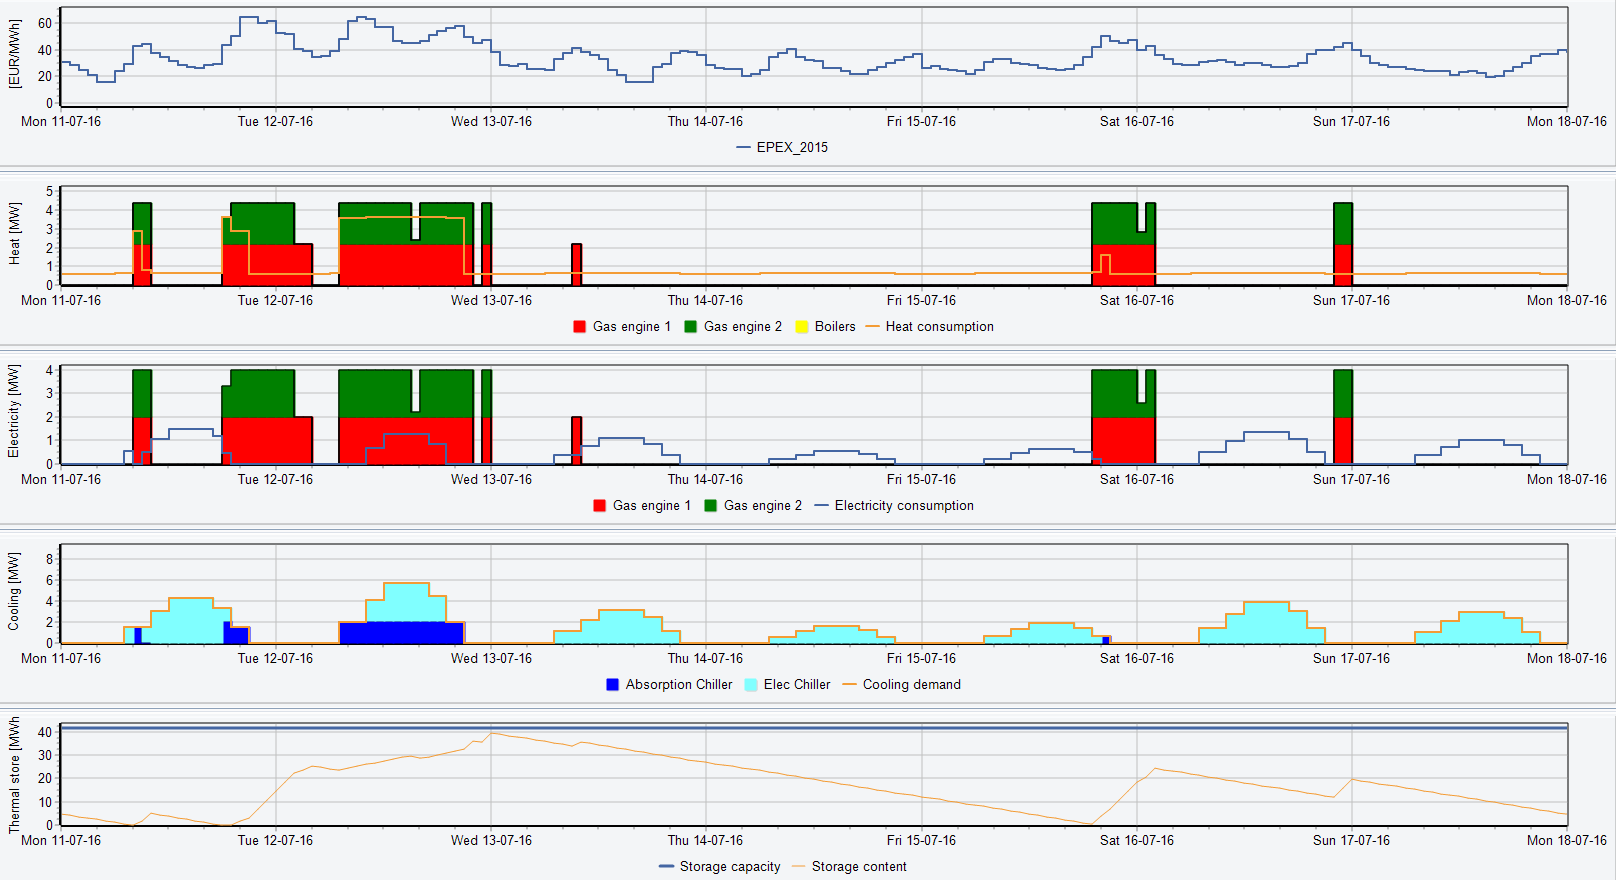
In the figure, a graphical representation of the operation can be seen. The figure is composed of five graph windows: The top graph shows the EPEX electricity price in every hour. The second graph shows the heat production of the different units and the total heat demand including the heat consumed by the absorption chiller. In the third graph, the electricity production and consumption can be seen. The fourth graph shows the cooling demand and the cooling production from the two chillers. The fifth and last graph shows the storage capacity and its content.
From the figure it can be seen that the two CHPs (red and green colors) are producing in hours with high electricity prices. When excess heat is available and at the same time there is a demand for cooling, the absorption chiller (dark blue color) will consume heat and produce cooling. Since there is no cold storage in the model, cooling must be produced as it is needed and the electric chiller (light blue color) will cover the rest of the cooling demand. The gas boilers are operated only when the heat demand cannot be covered by the CHPs and the storage tank is empty.
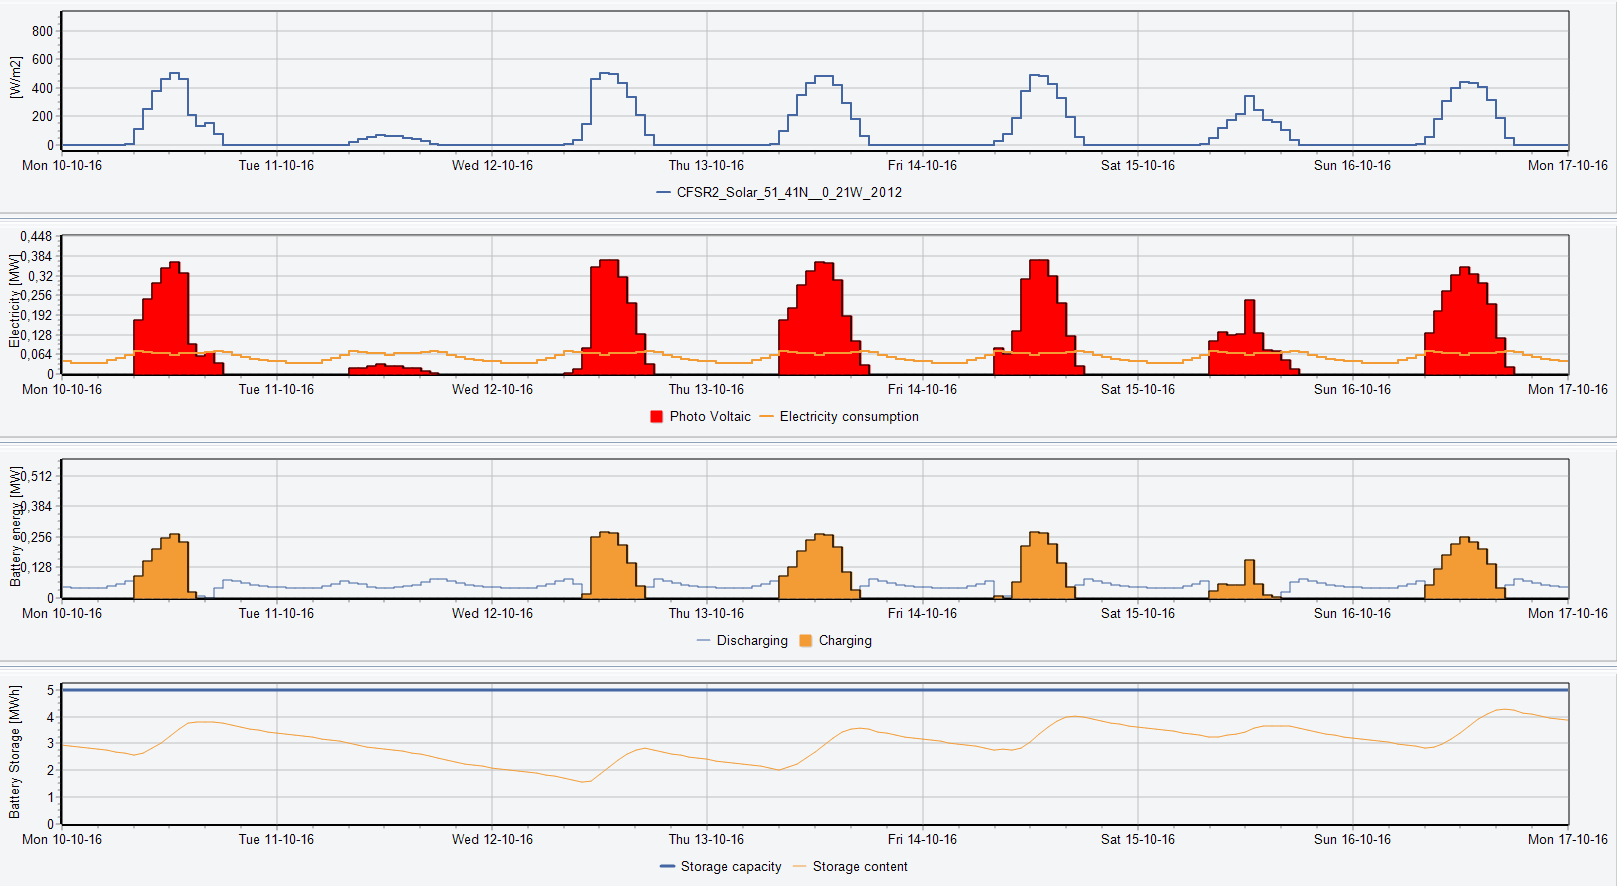
Photovoltaic and battery on fixed tariffs
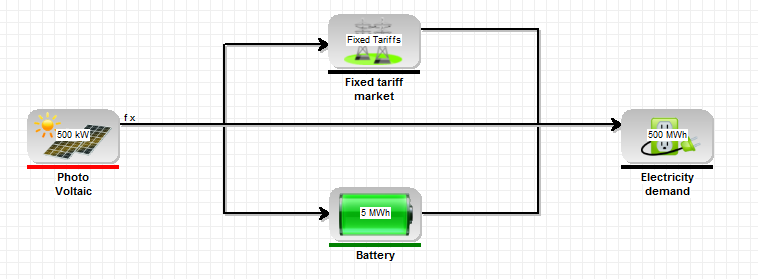
This project includes 500 kW photovoltaics, a battery (5 MWh), an electricity demand and a fixed tariff market.
In this model, the optimal operation is simply to cover as much of the electricity demand by the PVs. If the demand cannot be covered by the PVs and the battery, electricity is imported from the fixed tariff market. Conversely, if more electricity is produced than can be consumed or stored in the battery, electricity is exported.
In the next figure, a graphical representation of the operation can be seen. The figure is composed of four graphs: The top graph shows the solar radiation in every hour for the given location. This is used to calculate the electricity production from the PVs. The second graph shows the electricity production from the PVs (red color) and the total electricity demand (orange curve). The third graph, shows the charging (orange color) and discharging (blue curve) of the battery. The last graph shows the electric storage capacity and its content.
As it can be seen in the figure, the battery is charged when electricity production from the PVs exceed the demand. In hours with no or little electricity production from the PVs, the battery is discharged, supplying the demand.