PERFORMANCE CHECK
PERFORMANCE CHECK offers a unique set of tools to analyse wind turbine SCADA data.
Quantify losses, improve pre-construction estimates and lower your AEP uncertainty.
-
Analyse SCADA Data
Import production data, error codes and wind data to analyse the operation of a wind farm. -
Evaluate Losses by Error Codes
Quantify how much energy has been lost by using error codes and compare the actual and potential production.
-
Calculate Expected Future Yield
Project the actual production and losses into the future -
Calibrate Flow Models
Lower the uncertainty for re-powering projects by using actual production data to calibrate the flow model. -
Add-on: TR10
Implementation of the first national standard for post-construction.

Gain information to increase net income
SCADA data analysis is becoming increasingly important for wind farm developers, consultants, owners, sellers and buyers, each for different financial reasons. The PERFORMANCE CHECK module offers many of the tools necessary to analyse wind turbine SCADA data which in turn can lower risks, reduce financial expenses, increase earnings, ultimately increasing net income.
Take advantage of a lower uncertainty
Using PERFORMANCE CHECK, you can use the measured energy production and error codes of operating wind turbines to predict the future energy production. Compared to the pre-construction yield estimate, this method of calculating long-term corrected AEP typically cuts the uncertainty by 50%.
Reducing the uncertainty on the AEP has several financial benefits:
- A wind farm can be re-financed with a lower risk, and thus reduce interest rate and/or premiums.
- The seller of a wind farm can use the lower risk to negotiate a better transfer price.
- The buyer of a wind farm gets a safer investment.
- Both buyer and seller have an accurate reference when adjusting the asset transfer price.

Improve park performance
Using PERFORMANCE CHECK, you can quantify the lost production using production data, error codes and wind measurements. By identifying lost production and sub-optimal performance it is possible to evaluate and take action to improve the operation of the wind farm, consequentially increasing revenue. Knowing the cost of an error code can also be used to inform decisions on repair and maintenance.
Plan better
Planning wind farms is all about creating a representative flow model. With PERFORMANCE CHECK, you can calibrate your flow model with actual production data, creating an even better pre-construction estimate for your next project better. This is especially useful when:
- Repowering windfarms
- Expanding a windfarm
- Performing in-house quality control of pre-construction analysis

Analyse SCADA Data
PERFORMANCE CHECK comes with a wide array of advanced tools, making it possible to import all kinds of SCADA data formats and perform different analyses such as:
- Post-Construction Loss Evaluation
- Long-Term Corrected Potential Production
- Flow Model Calibration
- Wind index calculation
- (TR10)
Powerful graphic tools
PERFORMANCE CHECK offers multiple graphs and tables capable of showing:
- All data as time series, diurnal, monthly or radar plots.
- Recovery rate.
- Different power curves.
- by sector, season and diurnal.
- for measured, contractual and calculated data.
- using nacelle wind speed or mast data, all with optional filters, averaging and truncations.
- A flexible XY-graph plotting e.g. RPM to pitch angle color coded with production.
- MTBF, MTTR, Error loss matrix, map diagram etc.

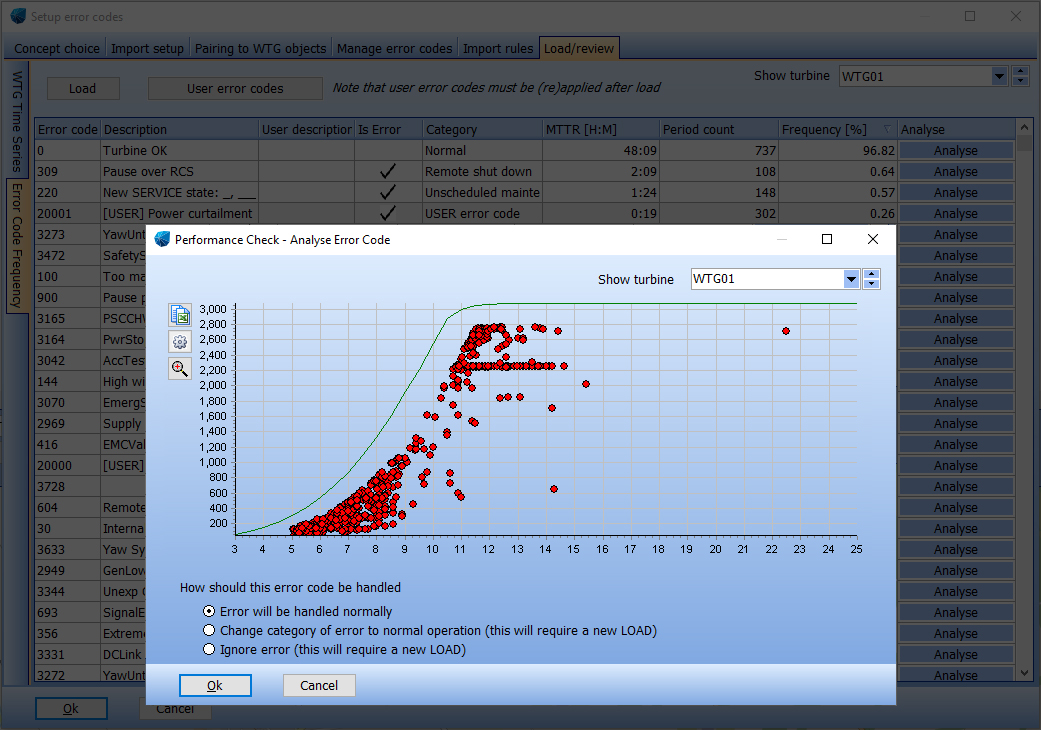
Evaluate Losses by Error Codes
PERFORMANCE CHECK uses measured production, wind data and combines them with error codes to calculate historic individual turbine power curves. Comparing the optimal error-free production with the actual production reveals the turbine losses. The concept is simple, yet difficult to execute. PERFORMANCE CHECK helps you handle all the data and data formats.
Flexible data import
PERFORMANCE CHECK’ s data importer is capable of reading nearly any kind of error code format. It is capable of handling error codes included in the same file as the production data or as separate error code files, with or without start/stop times or as durations.
Sometimes multiple error codes overlap in the same time step, and sometimes error codes only appear for a few inconsequential seconds.
In any case, PERFORMANCE CHECK is able to handle these issues and more.
Sub-Optimal Performance
In many SCADA data file dumps, not all non-optimal events have an error code assigned. With PERFORMANCE CHECK, you can automatically generate user-defined error codes capable of identifying curtailment, turbine stop and cut-out. This information may become crucial when analyzing the sub-optimal performance.

Calculate Expected Future Yield
Updating the long-term AEP estimate of an operating wind farm has never been easier.
Once the actual losses and potential production has been evaluated in PERFORMANCE CHECK, it only takes a few clicks to generate a 100% availability, potential production as gross monthly production time series. This monthly production is then long-term corrected using a wind index of your choice to calculate the actual and future normalized production for the next 20 years.
A report summarizes the expected future yield of the turbines, including the historic power curves, future losses, index correlations etc.


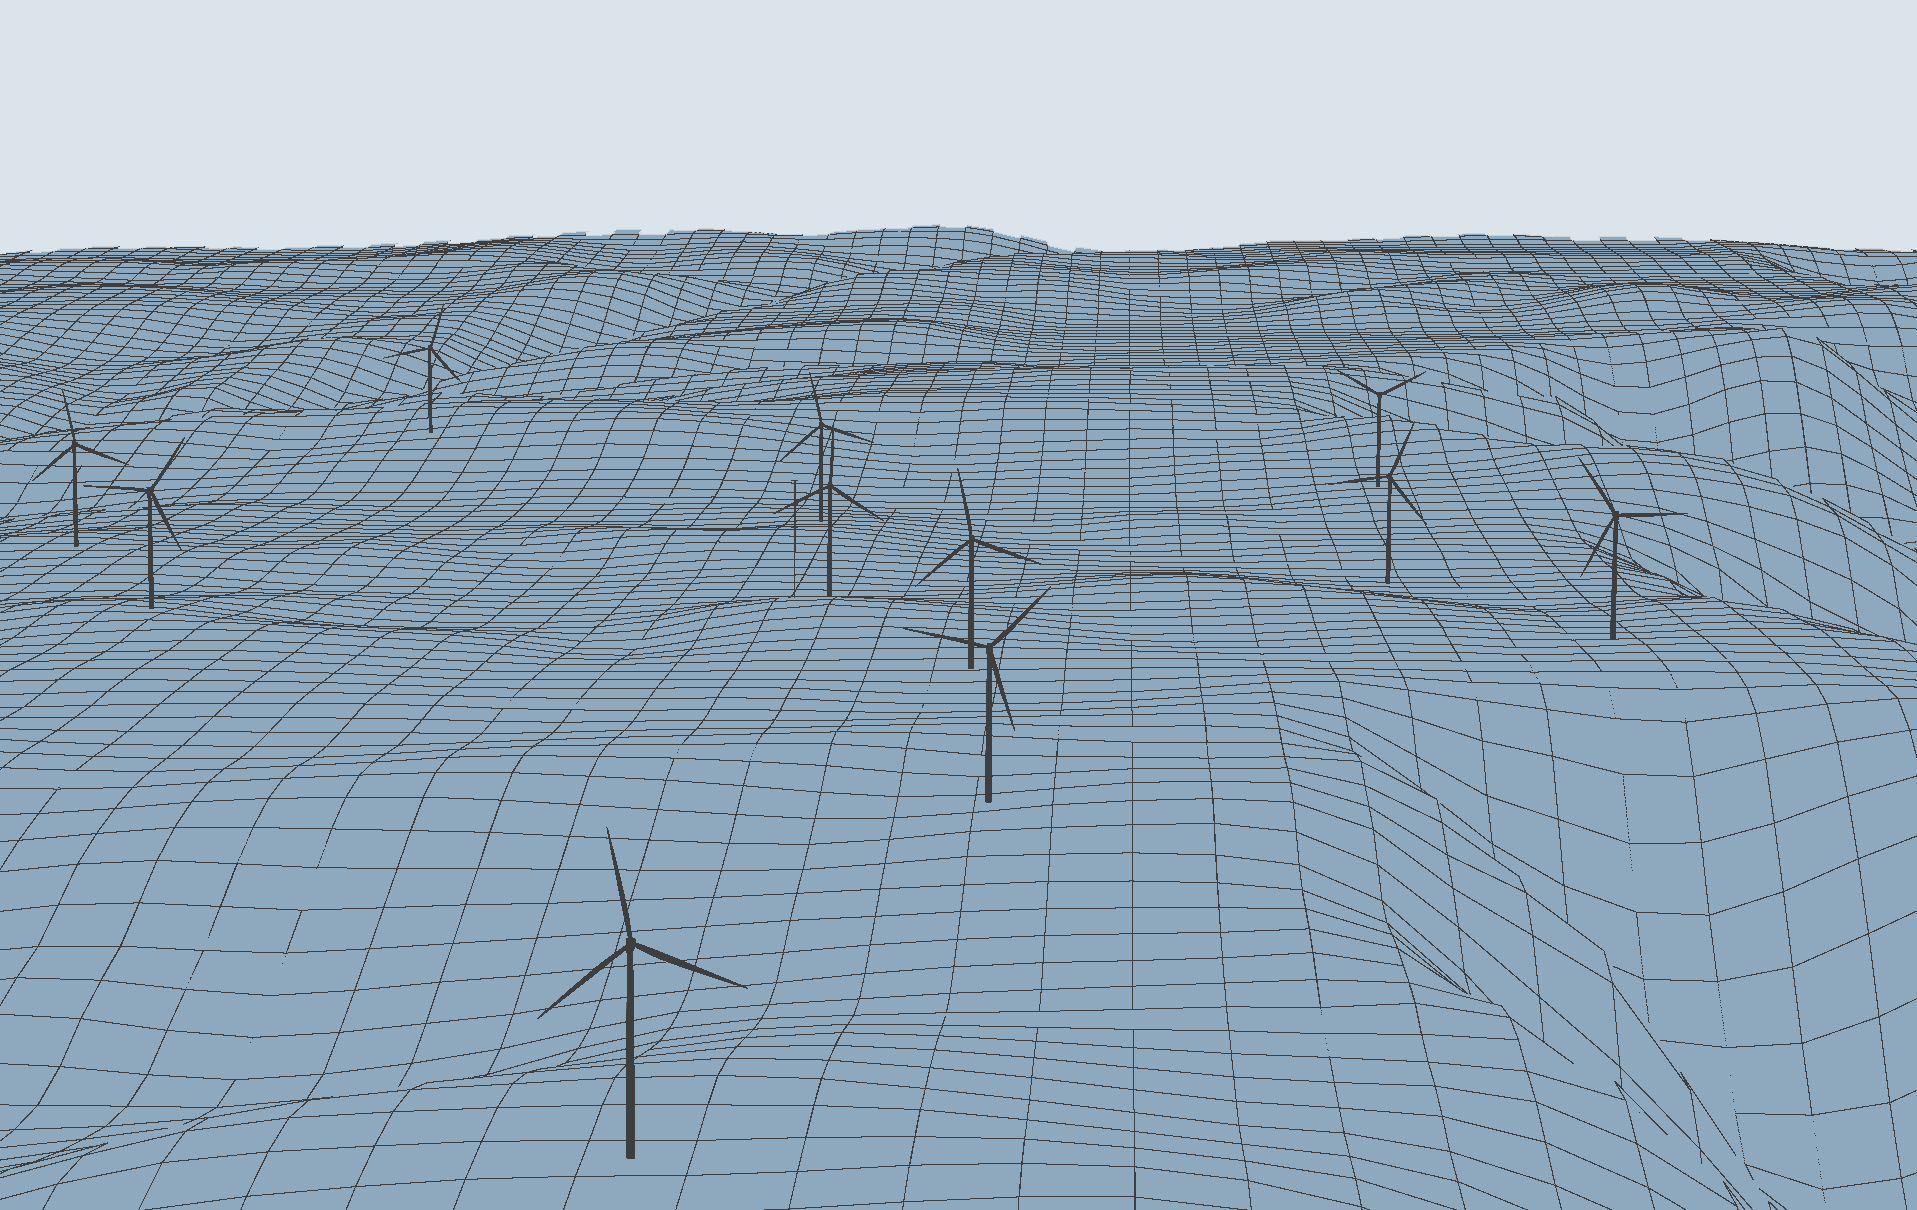
Calibrate Flow Models
Use actual production data to calibrate a flow model for future wind farm construction near the site (expansion) or when replacing turbines (re-powering).
Can use a flow model
PERFORMANCE CHECK is capable of loading and creating time-varing PARK calculations based on measured wind from nacelles, masts or EMD Mesoscale data, all with optional air densitiy, turbulence and temperature correction, including wake- and flow-modelling.
With detailed production data (e.g. 10-min. or hourly), an analysis of calculated production versus measured production can be performed by direction, season, day/night, temperature, etc.
Tuning the model
By adjusting the flow model parameters, the wind model is calibrated to the site climate, increasing the accuracy of new pre-construction estimates for the expansion or re-powering project.

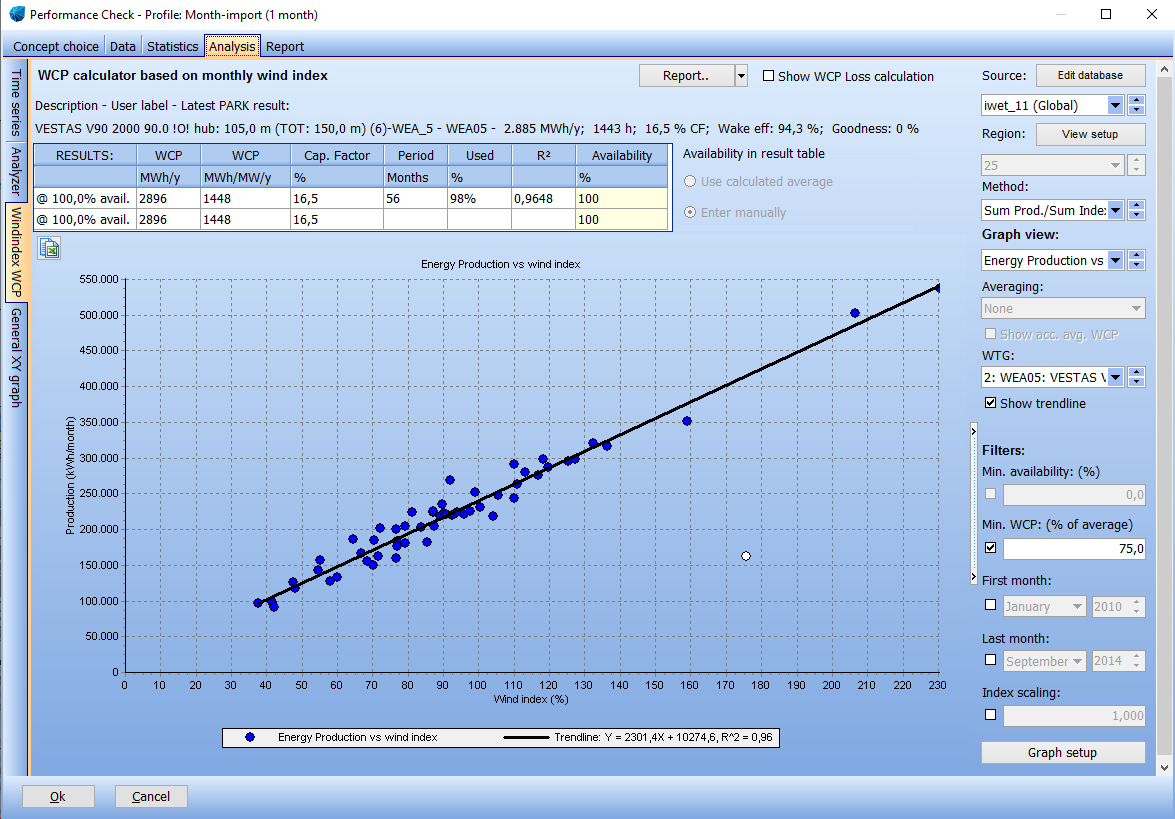
Wind Index Calculated Production (WCP)
PERFORMANCE CHECK also includes comprehensive tools to calculate a long-term expected production based on the wind index correction method. This relatively simple method relies on monthly production data and monthly wind energy indexes. Monthly wind energy indexes can be calculated inside PERFORMANCE CHECK using e.g a EMD-WRF dataset or download country-specific datasets. Further included are multiple graphs dedicated for the WCP method, along with a rough loss estimator and uncertainty evaluator.

Add-on: TR10
Determine the site yield of operating turbines in accordance with TR10 (Technische Richtlinie 10) which is a guideline in Germany. This is used when periodically re-evaluating the awarded subsidy according to the German Renewable Energy Sources Act 2017 (Erneuerbare-Energien-Gesetz; EEG 2017).
TÜV SÜD has certified the methods for evaluating WTGs with availability above 98% , resp. between 97% and 98% according to the TR10, rev.0.
Visit the TR10 module desciption for more information.
