PARK
PARK is a very flexible tool for calculating the AEP (Annual Energy Production) for one or more wind farms.
-
Calculate Annual Energy Production
Combine flow and wake models with site data to calculate the energy yield of multiple different turbines -
Time Series or Wind Statistics
Use time-series to perform modern calculations or use wind statistics. Both tested by time, each with benefits. -
Different turbines and hub-heights
Distinguish between new turbines, existing turbines and neighboring turbines. Quantify new losses. All in one step. -
Operation-modes
Quantify losses/gains of running turbines in different operation modes at various conditions and times. -
Input data
Take advantage of the huge library of data available in windPRO (power curves, meteorological data, terrain data, etc), and use it in PARK -
Reports and time series
Generate rich reports with graphs, tables and maps. Export detailed results and time series to files.
Calculate Annual Energy Production
There are no limits in using different WTG types or hub heights in same calculation. With the windPRO layer structure, several different layouts can be tested against each other quickly and easily.
The wind distribution at each WTG position is calculated /given using the METEO and/or MODEL modules. This means that the wind model can be based on either wind measurements, WAsP model calculations for each WTG location or a wind resource map from WAsP, WAsP-CFD or other sources.
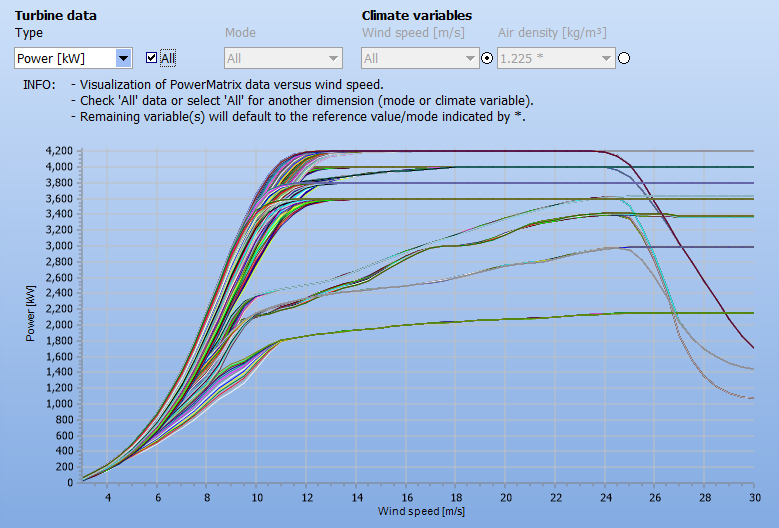
The wind distribution is then adjusted for array losses using one of three different models: the PARK model (N.O. Jensen), the eddy viscosity model (Ainslie, 1988) or the EWTS II (G. C. Larsen, 1999).
This requires information on the Ct-curves of the WTGs and a wake decay constant. Both can be adjusted in the user interface. A displacement height can be subtracted from the hub height of the turbines affected by the lifting of the wind profile over a forest. Finally, the adjusted wind distribution is integrated with the power curve of the WTGs for the energy yield calculation; the power curve at each tubine being corrected to air density; and for time-varying calculations also turbulence, shear and veer.
The PARK calculation can also include a RIX analysis, where the layout is examined for complex terrain problems. If the alpha parameter of the RIX method has been calculated in the Meteo Analyser tool, it can be used to correct the AEP directly in PARK.
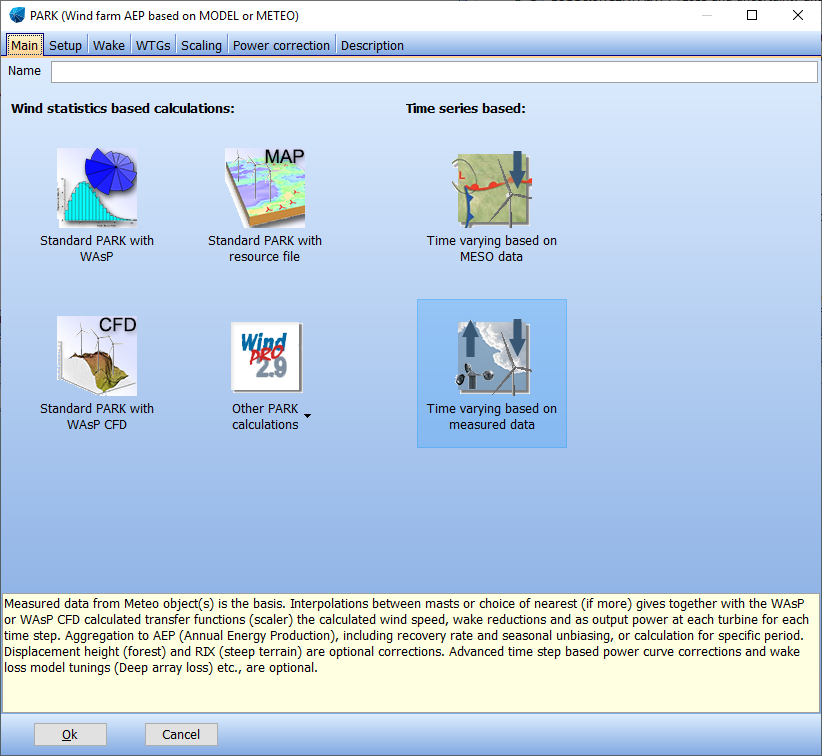
Time Series or Wind Statistics
The PARK module can perform both time-varying or statistics-based AEP calculations using input data from the METEO and/or MODEL modules.
Multiple sets of wind data can be used in a park calculation, e.g. wind measurements from different locations in a wind farm area. The park calculation automatically takes the nearest set of wind data, or let the user decide. When using WAsP, individual wind data is calculated from one or a combination of wind statistics to each WTG position with just one site data object linked to digitized height contours and roughness lines. Local obstacles are treated individually relative to each WTG position.
As an alternative to wind statistics, long-term EMD mesoscale data can be used in a PARK time varying calculation. The energy output is then calculated for the whole time series where the wake decay constant can be defined sector wise and the power curve adjusted for air density, turbulence, shear and veer on each time stamps. The mesoscale data must be previously calibrated to the local conditions (measurements or production data) by making use of the Scaler tool. The Scaler allows calibrating the data sector wise including a daily and/or monthly correction factor.

Neighboring Turbines?
WTGs can be entered as both existing and new WTGs and treated separately in the printout, while all are included in the calculation. Even the loss of energy at existing WTGs caused by the new WTGs is calculated automatically in one process, if required.
Did you know?
You can use production data from existing turbines nearby to calibrate your calculation model when working with Repowering and Expansion projects. The calculated time-varying production for each turbine can later be used for detailed wake and performance analyses with the PERFORMANCE CHECK module.
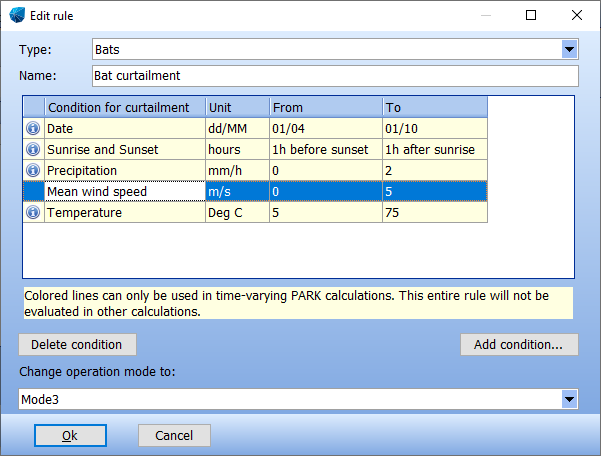
Operation modes
Configure the turbines to run in different operation modes depending on wind speed and direction. Use additional climate and time conditions such as sunset, precipication and turbulence when running time-varying PARK calculations.
The choice of operation mode strategy influences the wake loss of downstream turbines, influencing their operation conditions.
Losses or gains in production caused by changing the operation modes are quantified relative to not changing the operation mode.
Prioritized rules makes it possible to attribute losses to the correct loss categories such as noise reduction, wind sector management etc.
Input Data
Wind Turbine (Position and type):
The Power Curve and Ct curve of the WTGs selected can be found in the WTG Catalogue or alternatively added manually. PARK includes many advanced features for designing a wind farm layout, e.g. creation of rows with equal distance, cloning of these for parallel rows, use of distance circles around each WTG. Park layout coordinates can also be imported from ASCII files or spreadsheets simply by using the “copy/paste” function. A displacement height can be calculated sector wise for the turbines located in or close to forest.
All necessary elevation, roughness and meteorological data can be seamlessly downloaded though windPRO Online Data. The location of existing neighboring turbines can also be downloaded, sometimes with production data included.
Reports and time series
The report generator includes several printouts and analysis options. The following printouts are typically available: Main Printout, Reference WTGs, Energy Production Analysis, Power Curve Analysis, Terrain Analysis, Wind Data Analysis, Park power curve, RIX calculation, Displacement height, Scaler, Wind speeds inside wind farm, Turbulence reports and Maps.
The PARK module also includes reports with 24-12 tables and duration curves based on time series with wind variations.
Time series and detailed calculation results for all WTGs can be exported with “Result to file” text file for further processing in Excel or other tools.